
Logic
Developing Functionality Using Business Rules
The planning step sets the stage focused on clear objectives, a well-defined user, a set of actions or requirements and the value of those actions. Next, data sources can be identified in the form of questions, choices and results which will serve as the app foundation. However, logic is what makes an application a useful tool. The logic step begins with translation of best practices (e.g., evidence-based research, clinical guidelines, organizational workflow activities) into user stories, concrete business rules and logic steps. Thinking in terms of a user story and breaking it down into if/then conditions will help to identify the business rules and logic steps. Conceptualizing the logic steps in a diagram will help to identify functionality required to address each business requirement. Concepts can be further developed to solve for how the business requirement can be digitized to provide process automation using the app builder tools. The final step involves putting all of the logic puzzle pieces together and designing a comprehensive model that maps all of the logic requirements which will be covered in the design step. Let’s walk through several examples covering the building blocks of developing app functionality and practical ways to manage complexity as you develop app logic.
Use Case: Well's Criteria for PE
Consider this user story:
- As a primary care clinician, I want to use the Well’s Criteria to determine if a patient is unlikely to have a pulmonary embolism (PE) so that I can rely on a high sensitivity d-dimer test and take a more conservative approach to determining patient disposition.
Consider the following if/then conditions for the user story:
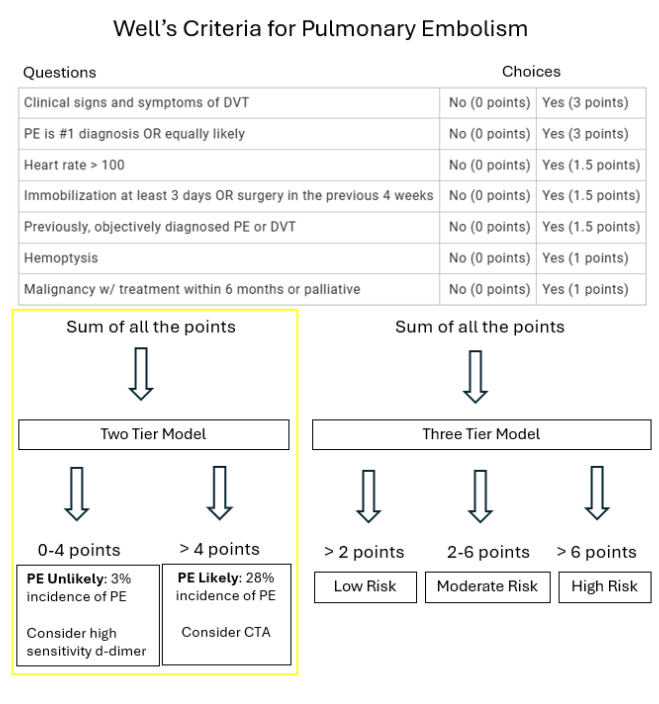
- If the sum (e.g., points) of the Well’s criteria (e.g., choices) is <5, then PE is unlikely and the clinician ought to consider high sensitivity d-dimer testing
- If the sum (e.g., points) of the Well’s Criteria (e.g., choices) is > 4, then PE is likely and the clinician ought to consider CTA imaging.
In this use case, the research literature offered two approaches in determining PE risk stratification. The two-tier model best aligned with the value statement, “..so that I can rely on a high sensitivity d-dimer test….” The following concept map illustrates how the two-tier model solves for the clinician's needs, highlighted in yellow, based on the user story and conditions stated above. Conceptualizing how the Well's criteria will translate into a set of results with the primary care clinician's needs in mind and connecting value to each condition keeps the storyline focused, relevant and actionable.
Assessing & Managing Complexity
Remember the “Choose your own adventure” books? The reader comes to a fork in the road in the story and their choice determines what happens next. Additionally, the series of choices the reader makes culminates into a final ending among a plethora of possible endings. A decision support app is structured in the same way. The app user is presented with a series of choices that culminate into a final result among several other possible results.
App logic can be simple to very complex. The Well’s Criteria for PE example above is an example of a simple logic model. However, depending on the factors involved in solving a problem, an app may require more advanced analysis and logic to support additional conditions, such as risk stratification calculations to accommodate population variables or application of diagnostic rules to an assessment tool. Before embarking on a decision support initiative, it is important to assess the level of complexity and the platform tools and skills required as you architect how to solve a problem.
Factors that complicate logic models include the following:
- Number of data sources (Questions and choices)
- Type of data source (Select one, Select multiple, Numeric or spreadsheet-based formula variables)
- Number of conditions
- Advanced spreadsheet-based formulas and functions
- Embedded apps
Number of Data Sources (questions and choices)
Developing a question and choice workflow.
EVAL has two workflow options. In the calculator workflow, all the questions and choices appear at the same time in the order they are built. In the decision tree workflow, the citizen developer will set the order questions and choices appear. Complexity increases based on the number of forks in the road. If a choice selection drives which question or set of questions appear next, it is important to ensure every choice and choice combination (i.e., fork in the road) is accounted for. The EVAL feature, Visibility Rules, dictate when questions or choices will appear. Another EVAL feature called, Errors, will flag questions without choices or missing visibility rules. The calculator workflow does allow for visibility rules for added flexibility.
Type of Data Source (select one, select multiple, numeric or spreadsheet-based formula variables)
Every possible choice (i.e., select one or select multiple) must be linked to a result.
When setting up a question, EVAL features include a select one or select multiple choices. Allowing a user to select multiple choices within a question is another way to layer in additional complexity. It is often helpful to think in terms of a Punnett square to ensure all the choice combinations are accounted for and there is no overlap or dead ends in your logic as you link choices and results. For example, if you make a question with 3 choices a select multiple instead of a select one, that question now has 7 possibilities to account for. In this example, a Punnett Square is used to find the possible outcomes of the following multi-select question.
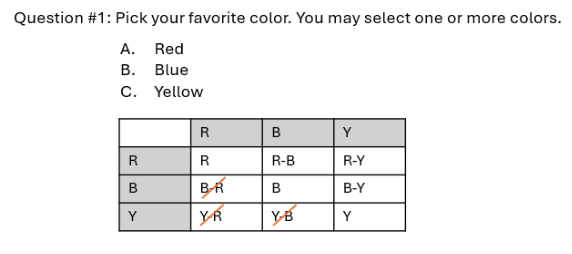
After excluding duplicates, you get the following possibilities: Red, Blue, Yellow, Red & Blue, Red & Yellow, Blue and Yellow, and Red, Blue and Yellow (include selection of all three). Thinking in terms of a Punnett square and sketching out a concept map to link choices to results can help you stay organized and ensure a coherent user experience.
Numeric inputs must be defined and accounted for.
When setting up a question, EVAL features allow you to set up a numeric input box, set a numerical boundary, add a unit of measure and set up unit conversion options. When utilizing spreadsheet-based formulas to perform calculations it is important to align units of measure across inputs and outputs. EVAL automatically uses the primary unit of measure in a numerical question to perform a calculation. If the primary unit of measure is different from the units in a formula, an additional conversion will be required in the formula. It is often best to set the primary unit of measure in a question to match the units required in the formula and provide an additional unit conversion option in the question to accommodate user preferences.
Harnessing well-organized spreadsheet-based formulas can solve for and manage complexity.
EVAL leverages the power of spreadsheet-based formulas as a tool to automate decision tree steps and perform complex computations requiring a range of inputs (e.g., age, gender, lab values, race). The citizen developer can implement complex logic with confidence by staying organized and following a few basic code formatting principles. For a deeper dive read the section below called, “Advanced spreadsheet-based features and capabilities.”
The EVAL formula feature allows you to break down a complex spreadsheet-based formula using named expressions and keywords - like a mathematical proof. Names expressions allow you to break up a large formula expression into smaller expressions using easy-to-read names. Keywords are used to aggregate and associate data sources to a simple label. A keyword label can be inserted into a named expression. Named expressions can be linked together to perform a set of computations and commands. The formula feature harnesses the power of spreadsheet-based formulas and organizes complex computations involving large data sets by breaking down logic into simple terms that can be easily traced and validated.
Number of Conditions
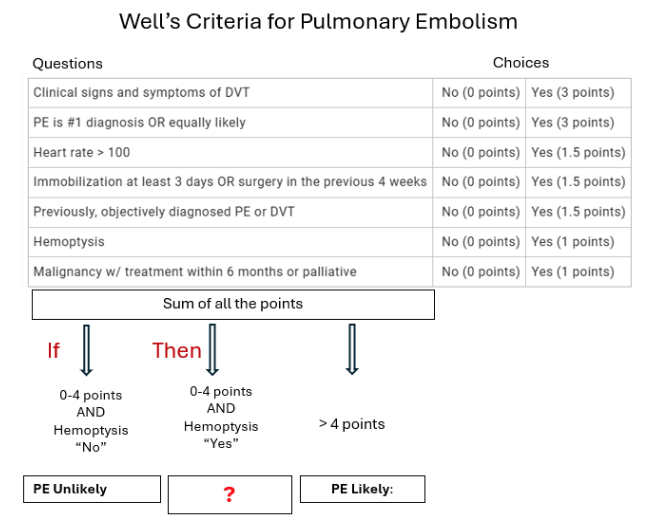
The more choice combinations (i.e., conditions) associated with a result, the more complex your logic map will be as you connect all the possible outcomes. The Well’s Criteria for PE is an example of a simple logic model leveraging a point system. A point value is assigned to each “select one” choice. The formula feature can be set up to sum the points and set up a unique point range as the visibility rule for each result. As you stack a combination of conditions (e.g., choices, calculations) in one result, your complexity increases. For example, I can stack multiple conditions to the result “PE Unlikely,” by adding to the first condition, the sum of the points must be <5 points, an additional condition of hemoptysis is “No.” However, as conditions are added, I must also consider inverse relationships, “What will happen if the score is <5 and the user selects ‘yes’ for hemoptysis?”
Therefore,
- If then sum is < 5 points AND hemoptysis is “No” then PE is unlikely
- If the sum is < 5 points AND hemoptysis is “Yes” then ?
- If the sum is > 4 points then PE is likely.
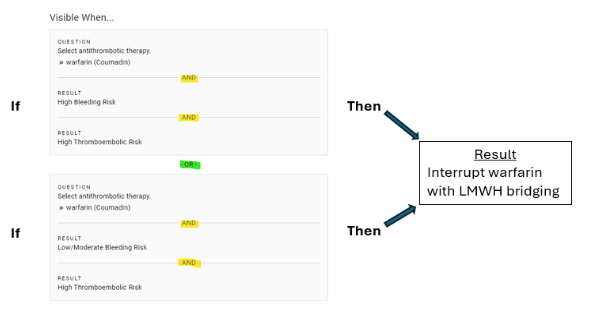
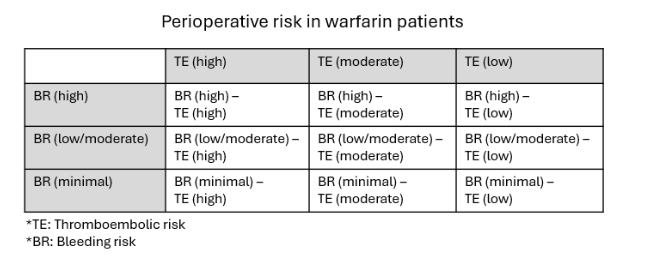
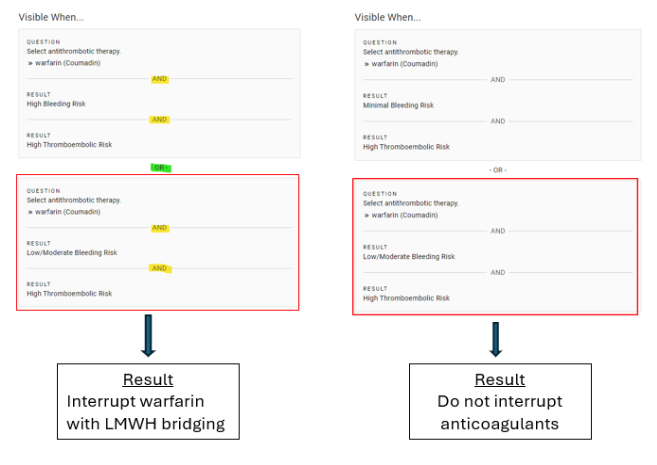
You can also set up conditions using “or” statements. In the example of Management of Anticoagulation in the Peri-Procedural Period (MAPPP) app, the level of bleeding risk (e.g., high, low, minimal) and thromboembolic risk (e.g., high, moderate, low) determines if you interrupt warfarin with LMWH bridging. There are two sets of conditions that are linked to warfarin interruption. The first set of conditions is defined by “AND” logic which requires all 3 criteria to be met for warfarin interruption. Adding a second distinct set of conditions using “OR” logic denotes that either logic set will satisfy the requirement for warfarin interruption.
A logic model may follow a 1:1 pattern where each condition or set of conditions maps to a single result or in the warfarin use case above, two sets of distinct conditions can be mapped to one result. Regardless of the mapping pattern, the take home message is ensuring all combinations are accounted for and there are no unintended dead-ends or overlapping results. Let’s investigate this idea further.
In the warfarin example we notice 6 variables at play in risk stratifying patients. The variables characterize the level of bleeding risk and thromboembolic risk. Using a Punnett square, we see 9 combinations that must be mapped into a coherent logic model.
In the example below, the same condition set has been unintentionally mapped to two different (and conflicting) results.
Whether you add multiple conditions to a result or add a question with multi-select choices, all possible outcomes must be accounted for. Without good data and logic modeling, the user experience is at risk to encounter dead ends and errors. To prevent unintended consequences, there are additional strategies, such as concept mapping, creating test scenarios and peer reviewing, that are discussed in the next section, Analyzing Logic Architecture for Completeness.
Advanced Spreadsheet-based Features and Capabilities
Digital spreadsheet programs (e.g., Excel) provide a vast array of features and capabilities. Spreadsheet programs store and organize information into cells and sheets, and behave like a "what if" machine, able to quickly perform all manner of calculations with that data.
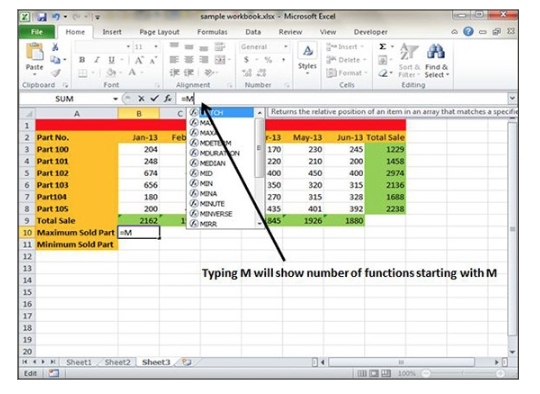
EVAL platform integrates with spreadsheet-based language and can perform most of the spreadsheet-based formulas and functions users are accustomed to.
EVAL’s graphical user interface (GUI) replaces the digital spreadsheet format of cells, sheets and data storage, and provides an intuitive formula feature which is seamlessly integrated throughout the app builder.
The EVAL formula feature responds to most of the following spreadsheet-based features, allowing citizen developers to dictate workflow, display results and perform calculations:
- Arithmetic operators
- Numeric comparison operators
- Logical functions
- Math functions
- Flow control
- Conditional computations
- Text functions
While spreadsheet-based formulas can power complex logic and make sense of data, the first task of the citizen developer involves analyzing spreadsheet functions and translating the user story and business rules into a comprehensive spreadsheet-based language that solves for the core objective.
Let’s take a look at one example. Working with the EVAL formula feature, we can create an app that will calculate glomerular filtration rate (GFR) based on the 2021 CKD-EPI creatinine recommendations.
Here is the 2021 CKD-EPI creatinine formula:
- = 142 x (Creat/A)^B x 0.9938^age x (1.012 if female)
- A & B as follows:
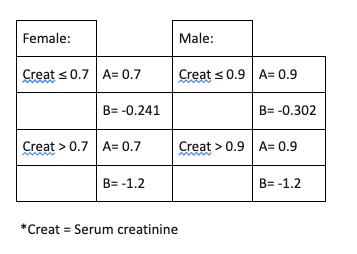
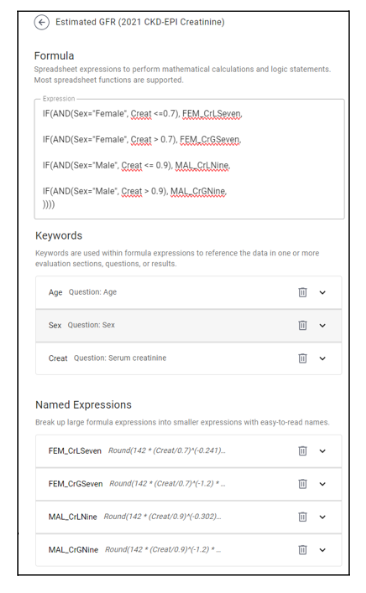
The EVAL formula feature depicted below demonstrates how a spreadsheet-based formula expression (top box) can be simplified using keywords and named expressions to calculate the glomerular filtration rate (GFR). The citizen developer chooses the labels used in the formula expression.
Keywords identify the data sources (e.g., age, sex, creatinine) used in the computation. Named expressions break up large formula expressions into bite size computations. The following named expressions are organized by the business rules:
- If female AND creatinine ≤ 0.7 then Round(142 (Creat/0.7)^(-0.241) 0.9938^Age _1.012)
- If female AND creatinine > 0.7 then Round(142 (Creat/0.7)^(-1.2) 0.9938^Age _1.012)
- If male AND creatinine ≤ 0.9 then Round(142 (Creat/0.9)^(-0.302) 0.9938^Age)
- If male AND creatinine > 0.9 then Round(142 (Creat/0.9)^(-1.2) 0.9938^Age)
By using keywords and named expressions, and writing formula expressions in organized bites of code, it is much easier to follow the spreadsheet logic used in this example. A formula expression can be a simple formula or a series of conditional computations (i.e., true-false statements). Due to complex variables in this example, a series of true-false statements are used to automate the correct calculation based on the business rules that comprise the app logic.
Using EVAL’s intuitive interface, a cheat sheet and following a few code formatting tips, even beginners can jump in and implement spreadsheet-based language. EVAL will alert you of spreadsheet logic errors and the test scenario feature will allow you to test your formulas for accuracy. However, it is up to the citizen developer to troubleshoot any logic errors in the formula expression. Without good data and logic modeling, the user experience is at risk to encounter dead ends and errors.
Embedded Apps
Often clinical workflows reference additional recommendations or require additional calculations in order to arrive at a conclusion or result. A citizen developer can embed another app as they build on the app platform. The embedded app data sources and logic can be utilized in the new app. Here is an example using the IMPEDE-VTE app to quantify risk of venous thromboembolism (VTE) in patients with multiple myeloma. One of the risk variables requires a BMI score in order to calculate overall VTE risk based on a point system.
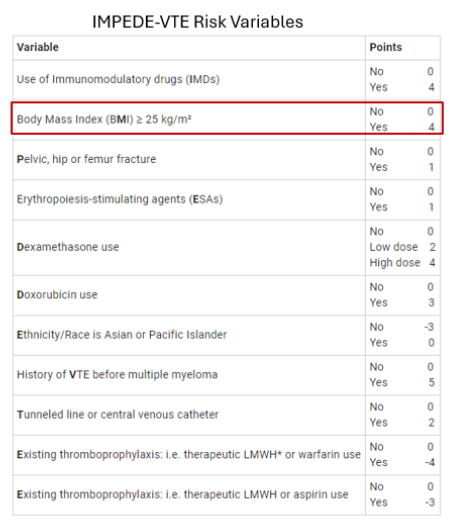
A published BMI app is seamlessly integrated as a part of the question workflow of the new IMPEDE-VTE app. The citizen developer simply creates a new section, selects the application format and searches the app library for the app. The clinician using the app is given the option to use the BMI calculator and the result is displayed in the right progress bar to assist in answering the next question.

The citizen developer must weigh the complexity of embedding an app. The first consideration includes how to set up the workflow to provide a seamless user experience. In the VTE example above, the logic integration of the embedded app was quite simple. The user can opt in to use the calculator and the calculation is displayed in real time in the progress bar for the clinician to reference to answer the next question. However, another layer of complexity may involve leveraging the results of an embedded app as a data source that can be called on by other calculations within the new app. Depending on the overarching objective of the app, the business rules of the embedded app and the new app may require careful analysis and integration. Without good data and logic modeling, the user experience is at risk to encounter dead ends and errors. To prevent unintended consequences, there are additional strategies, such as concept mapping, creating test scenarios and peer reviewing, that are discussed in the next section, Analyzing Logic Architecture for Completeness.
Updated over 1 year ago