
Intro to Charts
Charts Overview
The Charts component of EVAL is used to manage patients and administer patient evaluations in a private, secure, and compliant area. Features of this component will allow you to:
- Create simulated patients for a testing or practice environment OR host real patients (in future)
- Securely run applications to conduct patient evaluations
- Track patient progress for a holistic view of patient history
- Control access to patient data and EVAL apps that can be used on patients
- Integrate with EHR using SMART on a FHIR connection
Accessing Charts First Time
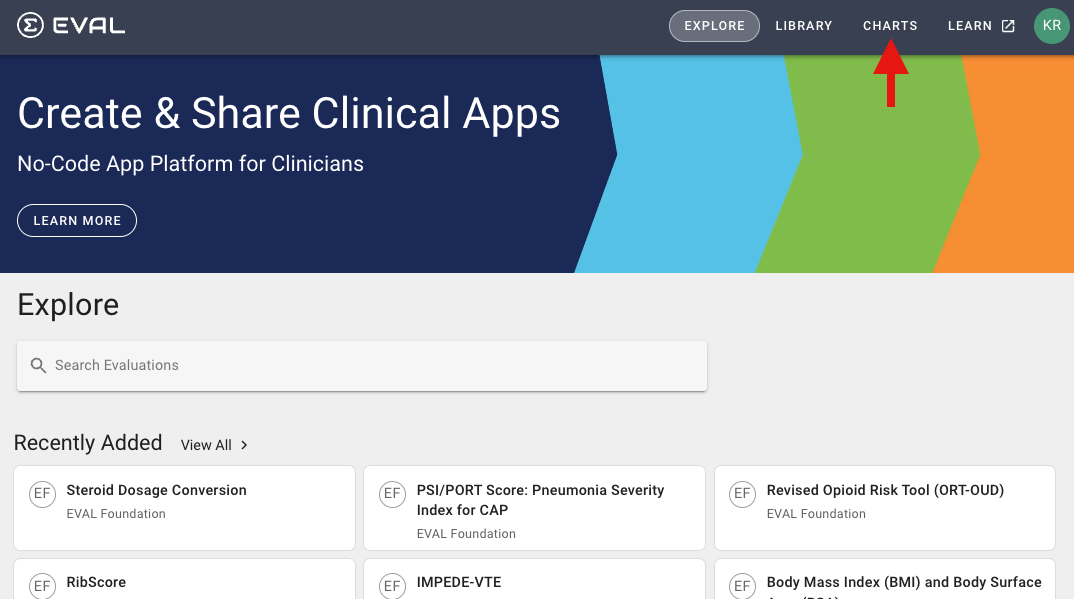
To begin, click Charts in the header:
When first navigating to Charts, you will have the option, to Start with Simulated Patients
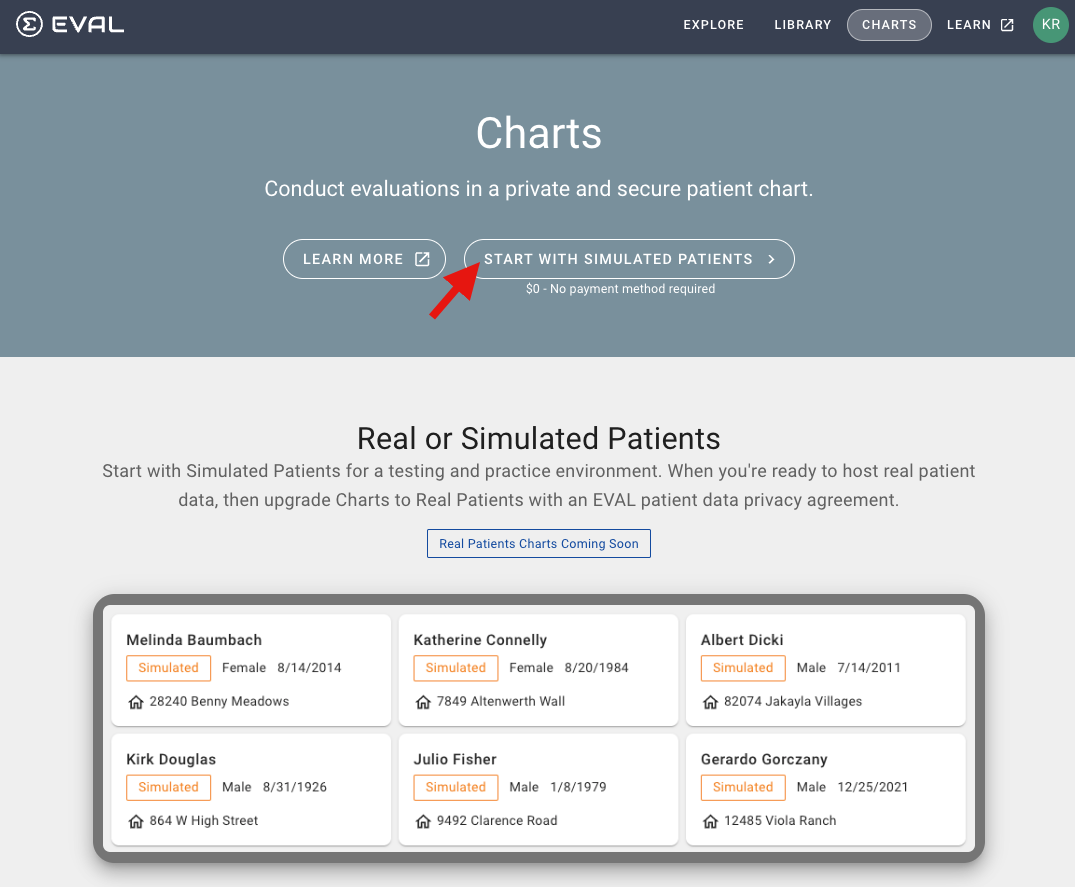
In simulated charts, you are provided pre-populated patients and limited to the data you can supply.The intention of the simulated environment is for health systems to test out EVAL and its applications before moving them to a production environment. It is a space for content creators to develop applications as well as provide medical training to health professionals. All patient data is pre-populated based on gender and age group supplied by the user and cannot be modified.
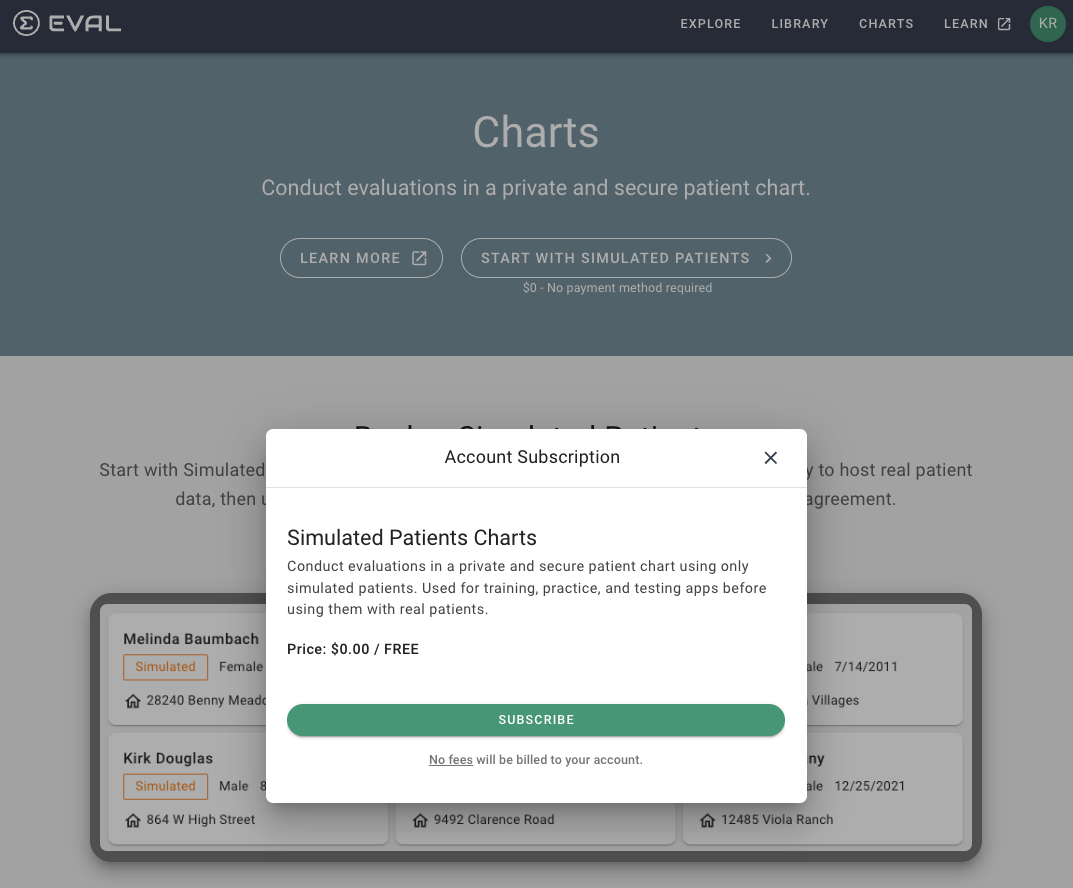
Once you have clicked Start with Simulated Patients (as shown in above image), you will receive an Account Subscription confirmation popup:
After you click Subscribe, you will receive confirmation of your subscription:
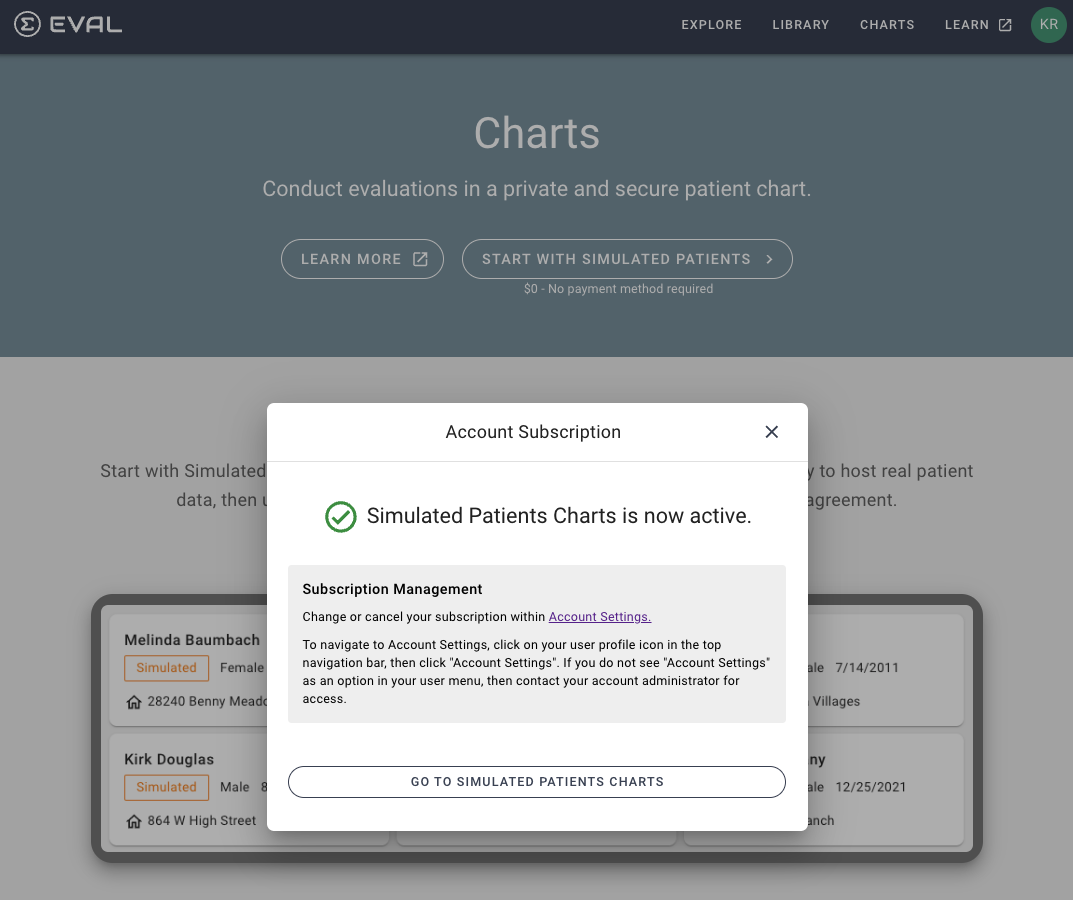
After clicking Go to Simulated Patients Charts, you be navigated directly to the Patients home page, as shown below.

The above image and all remaining documentation in this guide will show simulated charts with test patient data. The functionality will be similar between a simulated chart and real patient chart when it is available in the future; however, In simulated charts, you are provided pre-populated patients, as shown above with Johnathan Lowe.
In the remaining areas of the Charts Reference Guide, you will learn more about:
Updated over 1 year ago